- Intrinsic Growth Rate: The maximum potential for growth under ideal conditions and with unlimited resources available.
Because of this, the lemming and the arctic fox have very close intrinsic growth rates. Knowing that the lemming's intrinsic growth rate is 2, we can estimate that the arctic fox's intrinsic growth rate is similar to that. (No data could be found on the exact growth rate).
- Growth Rate Model Curve
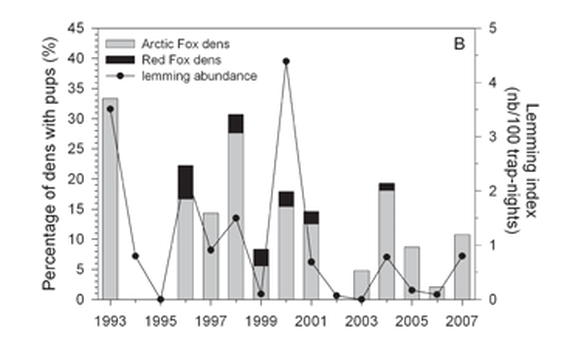
The above graph demonstrates the growth rates of both the lemming and the arctic fox. As you can see, there is about a 2 year time period in which the populations react to each other. For example, we can see that in 1993 there was a spike in arctic fox dens with pups. Two years after this spike, there was a dramatic decrease to near zero lemming offspring.
Arctic Fox Logistic Growth Rate: Nt=60000e2t
Lemming Logistic Growth Rate: Nt=67500e2t
Population Die-offs: A rapid decline in population due to a greater number of deaths than births.
- Logistic Growth Rate
Arctic Fox Logistic Growth Rate: Nt=60000e2t
Lemming Logistic Growth Rate: Nt=67500e2t
- Population Overshoots and Die-offs
Population Die-offs: A rapid decline in population due to a greater number of deaths than births.
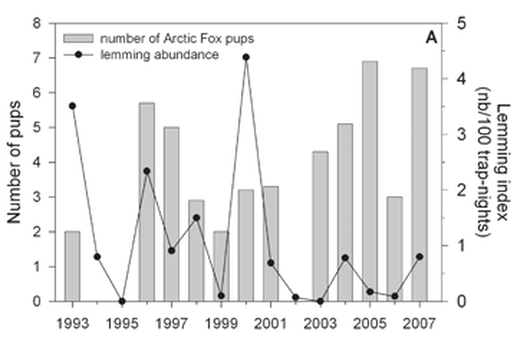
The above graph demonstrates the relationship between population die-offs and overshoots in the lemming and arctic fox populations. There is a clear overshoot in the lemming population in 2000, followed by an extreme resulting die-off in 2001. At the same time as the lemming population die-off in 2001, there is a die-off in the arctic fox population. This demonstrates the dependence that each population has on the other.
- Survivorship Curve
In the survivorship curve, the arctic fox is categorized as type 1 and the lemming is categorized as type 3. The arctic fox is type 1 because it is a K-selected species: a somewhat large animal, with successful survival rates in early life, and death in large numbers at old age. The lemming is type 3 because it is a r-selected species: a rather small animal, with unsuccessful survival rates in early life (easy prey at a young age), and delivered in large litters.
